RCA - Root Cause vs Shallow Cause Analysis: What's the Difference?
- Bob Latino
- Nov 2, 2023
- 17 min read
Originally Published on March 18, 2021 | Updated November 1, 2023 | Published with permission

Abstract: Does procedural and/or regulatory compliance with RCA guidelines ensure Operational Reliability? Does it ensure improved Safety? Operational Reliability involves the aggregation of Equipment, Process and Human Reliability methods and techniques.
What is the difference between troubleshooting, problem solving and ‘RCA’? Are the outcomes different when we use The 5-Whys, The Fishbone or a Logic Tree/Causal Factor Type Tree?
Can deficiencies in our approach to RCA increase the risk of excessive downtime? These questions will be discussed in depth and contrasted using a common example to determine if we are applying a form of Root Cause Analysis or Shallow Cause Analysis.
“Cause and effect, means and ends, seed and fruit, cannot be severed; for the effect already blooms in the cause, the end preexists in the means, the fruit in the seed."
- Ralph Waldo Emerson, 19th century Transcendental philosopher - from Selected Writings of Ralph Waldo Emerson
Regulatory Compliance Versus Operational Reliability
We will start this discussion with a quote from an article in Quality Digest[1]:
“Is the healthcare industry in denial when it comes to practicing Six Sigma? The answer, unfortunately, is yes. Although the industry is slowly adopting the methodology, the majority of these initiatives aren’t designed to improve the quality of the medical treatment offered to patients. Instead, most health organizations focus on improving care from the administrative side. As a result, patients aren’t getting the quality improvements to which they are entitled. The real issues facing healthcare are ignored due to medical practitioners who are afraid to admit that the lack of quality care is a result of their own errors and inefficiencies.”
While this quoted article focused on the specific application of Six Sigma in healthcare, it may as well have been written about Root Cause Analysis (RCA) in industry as well. The driving force behind statements like the above is that regulatory compliance is being confused with Operational Reliability. We are being led to believe that if our RCA efforts are compliant, then the operation is more reliable (and thus safe). In the Quality Digest quote above we can be compliant yet not affect the Reliability of our operations. That should defeat the purpose of the intent of the applicable regulations. If it does not, then the regulation itself has loopholes. The question boils down to, if we pass a regulatory audit of our investigative practices, does that ensure the operation is any more reliable or safe? NO.
Let’s take the concept of ISO-9000 compliance. The usual mantra is “write what you do, do what you write”. This does not mean that what you wrote was correct. However, if you follow an incorrect procedure, you are compliant. Is your operation any more reliable or safe, as a result?
For the many that will read this paper they will be able to reflect on their own experiences under such conditions. They will read, think back and realize that success was tied to passing the audit as opposed to linking their ‘RCA’ effort to how the operation was made more reliable and safer. The concept of true Root Cause Analysis has been replaced with the concept of Shallow Cause Analysis as a result.
Analytical Process Review: Shallow Cause Analysis?
Shallow Cause Analysis (SCA) represents a less disciplined approach to Operational Reliability than holistic Root Cause Analysis (RCA). Many of the tools on the market today that are being referred to as Root Cause Analysis, fall short of the essential elements of an RCA. Typical tools in this category are the 5-Why’s, the fishbone diagram and many form-based RCA checklists. Many of these tools came from the Quality initiatives, which flourished in the 70’s and 80’s and remain ingrained in American corporations today.
We refer to these as tools and just like tools in a toolbox; we must use the right tool for the right project. Therefore, we must have a clear understanding of the scope of the project before deciding which tool is most appropriate.
When determining the breadth and depth of analysis required, we must explore the magnitude and severity of the undesirable event at hand. Typically, we would not conduct formal RCA on events, but rather their consequences. If we have an event occur, an undesirable outcome of some sort, then its priority is usually proportional to the severity of its consequences.
When is it appropriate to use brainstorming versus troubleshooting versus problem solving versus RCA? While a hundred definitions likely exist for each of these terms, we choose to use the following ones:
Brainstorming: A technique teams use to generate ideas on a particular subject. Each person in the team is asked to think creatively and write down as many ideas as possible. The ideas are not discussed or reviewed until after the brainstorming session.
Troubleshooting: To identify the source of a problem and apply a solution to "fix it".
Problem Solving: The act of defining a problem; determining the cause of the problem; identifying, prioritizing and selecting alternatives for a solution; and implementing a solution.
Root Cause Analysis: The establishing of logically complete, evidence based, tightly-coupled chains of factors from the least acceptable consequences to the deepest significant underlying causes.
In order to recognize what is Root Cause Analysis and what is NOT Root Cause Analysis (Shallow Cause Analysis), we would have to define what criteria must be met in order for a process and its tools to qualify as Root Cause Analysis. The following are what we consider the essential elements[2] of a true Root Cause Analysis process:
Identification of the Real Problem to be Analyzed in the First Place (Not Just Symptoms)
Identification of the Cause-And-Effect Relationships that Combined and Converged to Cause the Undesirable Outcome
Disciplined Data Collection and Preservation of Evidence to Support Cause-And-Effect Relationships
Identification of All Physical, Human and Latent Root Causes Associated with the Undesirable Outcome
Development of Effective Corrective Actions/Countermeasures to Prevent Same and Similar Problems in the Future
Effective Communication to Others in the Organization of Lessons Learned from Analysis Conclusions (Collaboration)
Brainstorming. This is traditionally where a collection of experts throws out ideas as to the potential causes of a particular event. Usually, such sessions are not structured in a manner that explores cause-and-effect relationships. Rather people just express their opinions and come to a consensus on solutions. When comparing this approach to the essential elements listed above, brainstorming falls short of the criteria to be called RCA and therefore falls into the Shallow Cause Analysis category.
Troubleshooting. This is usually a “band-aid” type of approach to fixing a situation quickly and restoring the status quo. Typically troubleshooting is done by individuals as opposed to teams and requires little to no proof or evidence to back up assumptions. This off-the-cuff process is often referred to as RCA, but clearly falls short of the criteria to qualify as RCA.
Problem Solving. This comes the closest to meeting the RCA criteria. Problem Solving usually is team-based and uses structured tools. Some of these tools may be cause-and-effect based, some may not be. Problem solving oftentimes falls short of the RCA criteria because it does not require evidence to back up what the team members hypothesize.
‘When assumption is permitted to fly as fact in a process, it is not RCA.’

Analytical Tools Review
The goal of this description is not to teach how to use these tools properly, but to demonstrate how they can lack breadth and depth of approach.
"Analytical tools are only as good as their users or put another way, ‘an analysis can only be as good as the analyst".
Used properly, any of these tools can be used comprehensively to produce desired results. However, experience shows the attractiveness of these tools is actually their drawback as well. These tools are typically attractive because they are quick to produce a result, require few resources and are inexpensive. These are the very same reasons they often lack breadth and depth.
5-Whys. Let’s start here. While there are varying forms of this simplistic approach, the most common understanding is the analyst is to ask the question “WHY?” five times and they will uncover the root cause.
The form this approach may look like is as follows:

There is a reason we do not see NTSB investigator’s showing the 5-Why approach at a press conference after an accident. The main flaws with this concept are that failure does not always occur in a linear pattern (rarely if ever based on my 38+ years in the business). Multiple factors combine in parallel, then they converge at some point in time to allow the undesirable outcomes to occur.
"Also, there is almost never a single root cause and this is a misleading aspect of this approach".
People tend to use this tool by themselves and not in a team, and rarely back up their assertions with sound evidence.
The Fishbone Diagram. The fishbone diagram is also one of the most popular analytical Quality tools on the market. This approach gets its name from its form, which is the shape of a fish. The spine of the fish typically represents the sequence of events leading to the undesirable outcome. The fish bones themselves represent cause categories that should be evaluated as to having been a potential contributor to the sequence of events. These categories change from user to user. The most popular categories tend to be:
· The 6 M’s: Methods, Machines, Materials, Manpower, Mother Nature, Measurement
· The 4 M’s: Methods, Machines, Materials, Manpower
· The 4 P’s: Place, Procedure, People, Policies
· The 4 S’s: Surroundings, Suppliers, Systems, Skills

The fishbone is often a tool used for brainstorming. Team members decide on the categories and continue to ask what factors within the category caused the event to occur. Once these factors are identified then they ask why the factors occurred and so on.
As a brainstorming technique this tool is less likely to depend on evidence to support hypotheses and more likely to let hearsay fly as fact. This process is typically also not cause-and-effect based, but cause-category based. The users must pick the category set they wish to use and suggest ideas within that category. If the correct categories for the event at hand were not selected, key root causes could be missed.
Logic Trees. The Logic Tree (or Causal Factor Tree) is representative of a tool specifically designed for use within RCA. The logic tree is an expression of cause-and-effect relationships that queued up in a particular sequence, at a particular time, to cause an undesirable outcome to occur. These cause-and-effect relationships are validated with hard evidence as opposed to hearsay. The evidence leads the analysis, not the loudest expert in the room.
A logic tree starts off with a description of the facts associated with an event. These facts will comprise what is called the Top Box (the Event and the Modes). Modes are the manifestations of the failure and the Event is “the least acceptable consequences” that triggered the need for an RCA. While we may know what the Modes are, we do not know how they were permitted to occur. So, we proceed with the questioning of ‘How Could’ the Mode have occurred?
How Could? vs Why?. Many have been conditioned to ask the question ‘Why’ during such analyses. However, using this methodology the initial question used is ‘How could’ when exploring the physical aspects of the failure. When looking at the differences between these two questions we find that when simply asking ‘Why’ we are connoting a singular answer and to a point, an opinion. When asking ‘How Could’ we are seeking all the possibilities (not only the most likely) and evidence to back up what did and did not occur.
This questioning process is reiterative as we follow the cause-and-effect chain backwards. Simply ask the questions, answer them with hypotheses and use evidence to back it up.
Human Roots. This holds true until we uncover the Human Roots or the points in which a human made a decision error. Human Roots represent errors of omission or commission by the human being. Either we did something we should not have, or we did not do something we should have done. At this point we are exploring the reasoning of ‘Why’ someone made the decision they did.
This is an important point in the analysis because we are seeking to understand why someone thought the decision they made, was the correct one at the time. At this point in the analysis, we do switch the questioning to ‘Why’ because we are exploring a set of answers particular to an individual or group. We are seeking their reasoning.
Latent Roots. Our answers are what we call Latent Root Causes or the organizational systems in place to help us make better decisions. The Latent Roots represent the rationale for the decision at the time that triggered the consequences to occur. These are called latent because they are always there lying dormant. They require a human action to be triggered and when triggered, they start a sequence of Physical Root Causes to occur. This error-chain continues, if unbroken, to the point that it results in an adverse outcome that requires an immediate response.
As can be told from this description, the logic tree approach is certainly cause-and-effect related, requires evidence to back up what people say and requires depth, the understanding of the flaws in the systems that contributed to poor decisions.
The failure of a process to achieve its designed objective has to do with the design of the linkages between steps in the process: how the steps relate to one another – the hand-offs. It is the interrelationships that are themselves prone to failure and that propagate the effects of a failure to other parts of the process, often in ways that are unexpected (side effects) or not immediately evident (long-term effects).[4 ] The logic tree’s strict adherence to graphically representing these tightly coupled[5] relationships make it more accurate than the other tools described for that reason.

In addition to these most commonly used approaches described above, many simply use form-based Root Cause Analysis. This is basically a one size fits all mentality. It is root cause ‘by-the-numbers’ similar to painting-by-the-numbers. The same questions are asked no matter the incident and opinions are often input as acceptable evidence. Checklists are often provided which give people the false sense that the correct answer must be within the listed items.
"No 'pick-list' RCA process can ever be comprehensive enough to consider all the possibilities that could always exist in each working environment."
However, the innate human tendency to follow the path of least resistance makes using picklists very attractive.
As noted, author Eli Goldratt says:
"An expert is not someone that gives you the answer, it is someone that asks you the right question.”
That is exactly what RCA is all about.
Many people choose to use form-based RCA systems because the regulatory authority seeking compliance, provides them free of charge and suggests they be used. The paradigm is that “we are using their forms so we will have a better chance of complying if we use them”. This may indeed be true but does not mean the analysis was comprehensive enough to ensure the undesirable outcome will not recur. Hence, once again, compliance does not necessarily ensure operational Reliability or Safety!
Technology Review
All the aforementioned tools can either be applied manually using a paper-based system, or automated using a form or fashion of software. One point we need to make clear is that software IS NOT a panacea for any analysis. We liken this to Microsoft Word®[6], if you do not know how to construct proper sentences, it is of little value. The same holds true for RCA software, if the analyst does not understand proper investigative methodology and technique, software will be of little value.
Paper-Based Approach. Experience shows most of the time such analyses are conducted using paper-based approaches (easel pad and sticky notes). This leads to a double handling of data and a time lag. After the team meeting, some poor sole must then re-input the data from the easel pads and post-its into an appropriate program (i.e. – word processor, graphics program or spreadsheet program). Then usually about a week later the information is disseminated to the team members for them to review and conduct their assigned tasks.
Once paper-based analyses were completed, they were then presented, distributed, and put into a flat file somewhere. One of the greatest advantages any organization can get from RCA is to raise the knowledge and skills of their workforce regarding how failures have occurred in the past. This is often referred to as lessons learned in the nuclear industry.
Software-Based Approach. The primary value of software is to efficiently document and disseminate information. Technology is more effective than humans in enhancing process consistency and in receiving, storing, and processing information. Technology does not take shortcuts. It is not influenced by emotion. And it has the advantage of being a long-term improvement in contrast to risk-reduction strategies that, say, focus on staff retraining.[7]
Reduction of Re-Work. Software can eliminate the double handling of data related to any analysis. Experience shows that this cuts the analysis time in half (on average), simply due to conducting the analysis if a more efficient manner and, getting people information quicker and reducing the amount of team member time required per analysis.
Institutionalizing Knowledge. Software also provides great flexibility in storage of analyses. All analyses can be stored in a single database that can be mined for lessons learned. For instance, if we would like to search the data base (often called data mining) for all analyses conducted on motor failures on the digester in the wood yard, we can easily do so to see how others have approached a similar problem we may be experiencing. Effective use of this sharing is often referred to as knowledge management or corporate memory.
Potential Technology Disadvantages. However, as with all advantages there come some disadvantages. Technology itself can intimidate people and create a resistance to their using it. We tend to trust humans as opposed to machines. For instance, “pilots tend to listen to the air traffic controller (as opposed to messages they receive from a machine) because they trust a human being and know that a person wants to keep them safe.”[8]
The Tools is Only as Good as the Craftsman. No matter the analytical process used, the tools employed in the execution or technology used; if the craftsman [analyst] using the tool is not educated properly the tool will not function to its fullest capability. Analysts must have a complete understanding as to the difference between a shallow cause analysis and a Root Cause Analysis. Without knowing the differences, how can they be sure they can be credible and thorough? If they are not sure they have captured all of the contributing causes they cannot ensure the undesirable will not happen again. Analysts must also have the desire and the will to find the whole truth and settle for nothing less. The problem with this purist approach is that many in the organization do not want to know the truth – that is another paper!
Case Study – Analysis Approach Comparison
Case Study Background: XYZ Company was receiving numerous complaints from a particular customer about contamination of their delivered product (solvent), which had visible black ‘specks’. This was unacceptable and the delivery was refused and returned by the client.
Let’s review this case and apply the 5-Whys, Fishbone and Logic Tree Approaches. This was actually done as a test with this particular client using 3 different teams. These are the results.
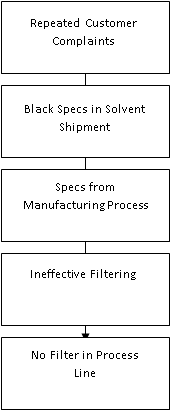
The 5-Whys
In this case ‘Why’ is asked 5 times after the Event, and in this case, concludes with a single cause of ‘Perceived as Not Required.
The Fishbone Diagram
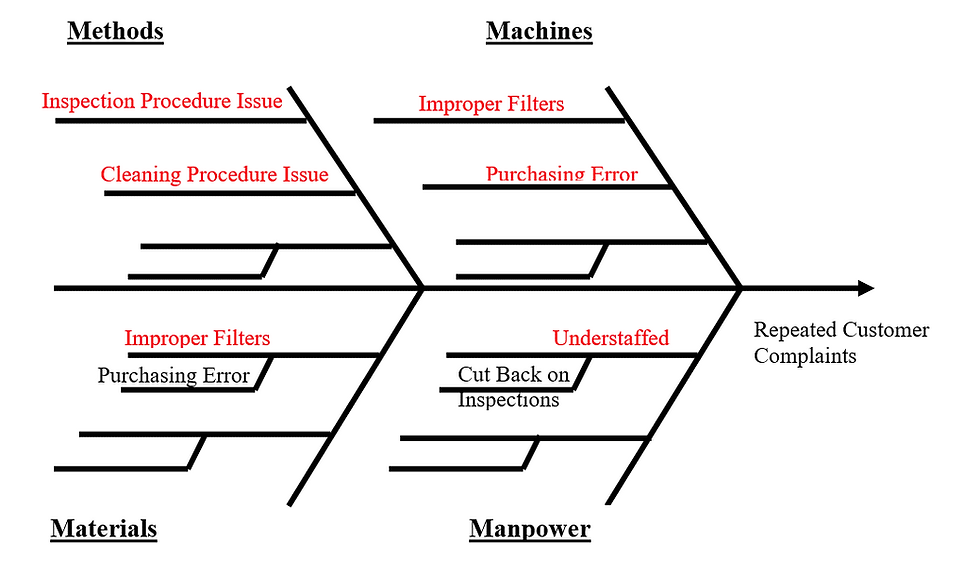
In this case the team applied the 6-M version of the Fishbone Diagram. Under the categories chosen, the following findings were concluded about the case…even though the team did not ask for evidence to support these conclusions. Also, it should be noted, that all of the teams were afforded the opportunity to ask for more evidence if they felt it would help their analysis to be more comprehensive.
The Logic Tree
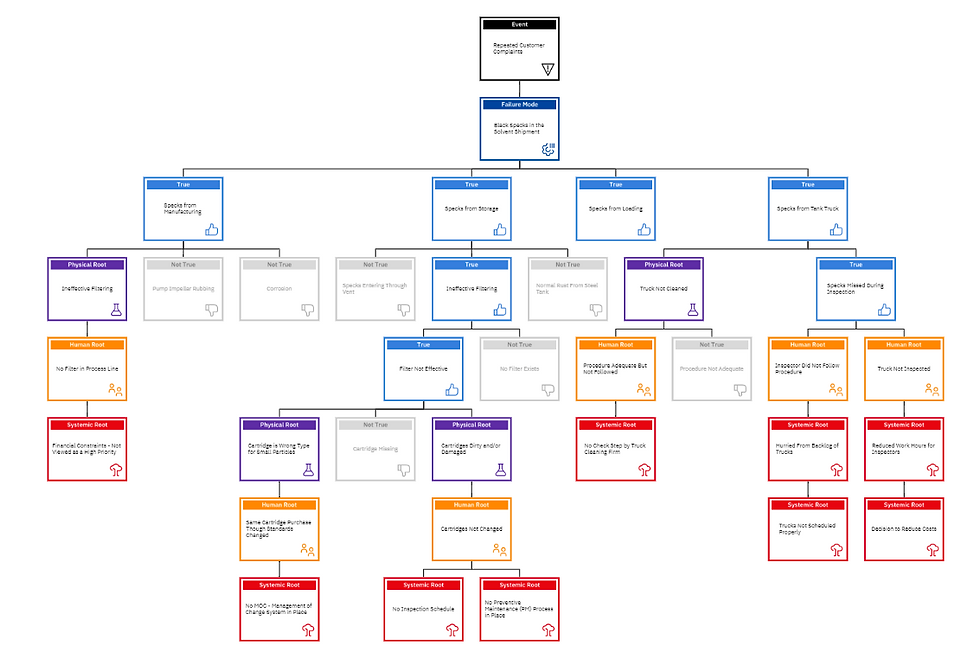
In this case, the team applied the logic tree approach to the same case.
I will describe their thought process simply using the consistent questioning process of this approach.
EVENT: Repeated Customer Complaints (This triggered the need for the RCA)
MODE: Black Specs in the Solvent Shipment (Validated fact by the customer)
1st Level of Hypothesis Questioning: How could black specs have gotten into the solvent shipment?
The Identified Potential Hypotheses:
1. From the Storage Facility
2. From the Tank Truck (Delivering Products)
3. From the Loading Process (of the Tank Trucks)
4. From the Manufacturing Operations
These are the only four (4) steps of the operation where the product could have been contaminated.
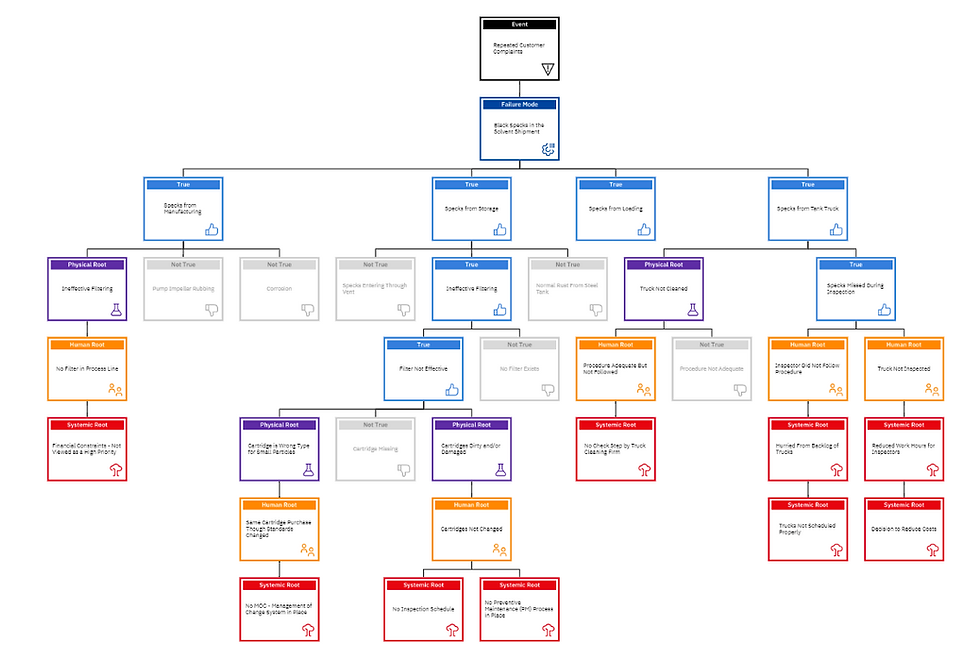
Evidence requested by the team of these hypotheses reveal that contamination was actually occurring at several steps of the process flow. However, there was no evidence of contamination entering the product from the tank truck loading operations, so that possibility is found to be NOT TRUE.
Now lets take each of the hypotheses found to be TRUE (using sound evidence) and continue drilling down with the ‘How Could’ questioning.
1. Hypothesis Questioning: How could the specks have gotten into the product in the manufacturing operation?
The Identified Potential Hypotheses:
A. Ineffective Filtering (TRUE)
B. Pump Impeller Rubbing (NOT TRUE)
C. Corrosion (NOT TRUE)
2. Hypothesis Questioning: How could we have had ineffective filtering?
The Identified Potential Hypotheses:
A. No Filter in The Process Line (TRUE) – Decision made not to install filter (Human Root)
3. Hypothesis Questioning: How could we have had ineffective filtering?
The Identified Potential Hypotheses:
A. No Filter in The Process Line (TRUE)
4. Hypothesis Questioning: WHY did we decide to not install the filter in the process line?
(Note: at the Human Root [decision point], we switch our questioning from ‘How Could’ to ‘Why’)
The Identified Potential Reasoning:
A. Financial Constraints – Not Viewed as a High Priority
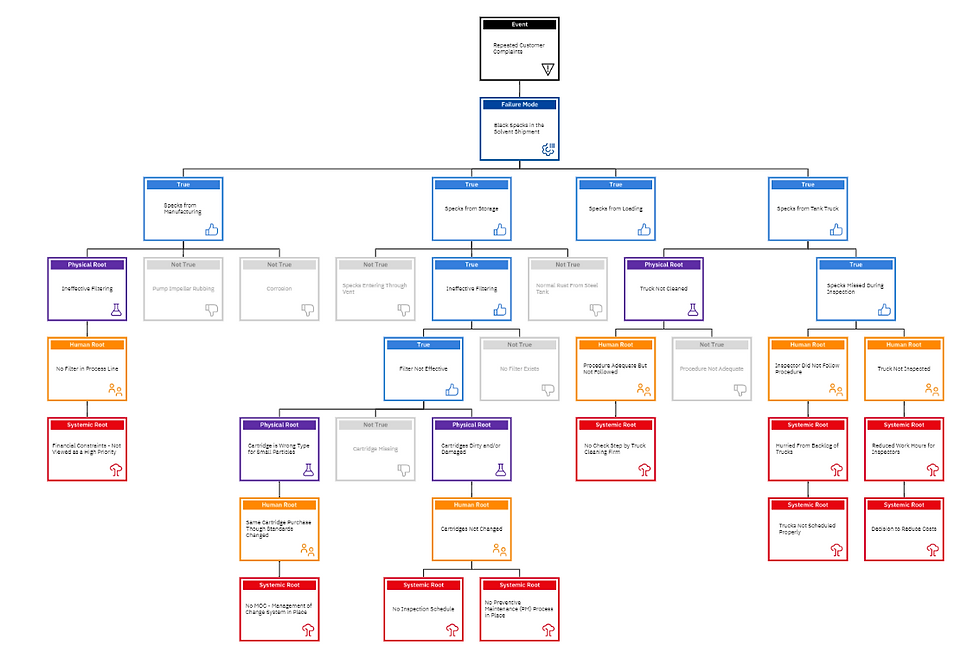
Now lets take each of the hypotheses found to be TRUE (using sound evidence) and continue drilling down with the ‘How Could’ questioning.
1. Hypothesis Questioning: How could the specks have gotten into the product from the storage?
The Identified Potential Hypotheses:
A. Specks Entering Through the Vents (NOT TRUE)
B. Ineffective Filtering (TRUE)
C. Normal Rust From Steel Tank (NOT TRUE)
2. Hypothesis Questioning: How could we have had ineffective filtering?
The Identified Potential Hypotheses:
A. Filter is Not Effective (TRUE)
B. Filter Does Not Exist (NOT TRUE)
3. Hypothesis Questioning: How could we have had ineffective filtering?
The Identified Potential Hypotheses:
A. Cartridge is Wrong Type for Small Particles (TRUE)
B. Cartridge is Missing (NOT TRUE)
C. Cartridge is Dirty and/or Missing (TRUE)
4. (Path 1) Hypothesis Questioning: How could the cartridge be the wrong type for small particles?
The Identified Potential Hypotheses:
A. Same Cartridge Was Purchased Even Though Standards Changed
5. (Path 1) Hypothesis Questioning: WHY didn’t we purchase the correct cartridge?
The Identified Potential Hypotheses:
A. No MOC (Management of Change) System in Place
6. (Path 2) Hypothesis Questioning: How could the cartridges have been dirty and/or damaged?
The Identified Potential Hypotheses:
A. Cartridges Not Changed
7. (Path 2) Hypothesis Questioning: WHY didn’t we change the cartridges?
The Identified Potential Reasoning:
A. No Inspection Schedule
B. No Preventive Maintenance Process (PM) in Place
Now lets move on and explore how we could be getting specks in the solvent via the tank trucks that transport the product to the customer. Here we will continue drilling down with the ‘How Could’ questioning.
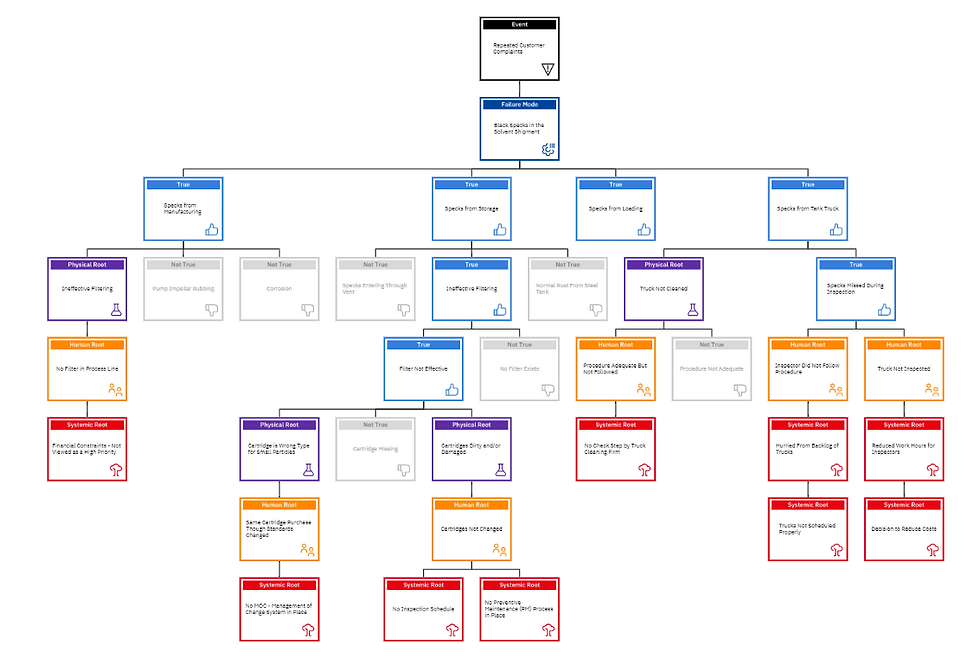
1. Hypothesis Questioning: How could the specks have gotten into the product from the Tank Trucks?
The Identified Potential Hypotheses:
A. Specks Missed During Inspection (TRUE)
B. Trucks Not Cleaned (TRUE)
2. Hypothesis Questioning: How could the specks have been missed during inspection?
The Identified Potential Hypotheses:
A. Inspector Did Not Follow Procedure (TRUE)
B. Truck Not Inspected (TRUE)
3. (Path 1) Hypothesis Questioning: WHY would the inspector NOT follow procedure?
The Identified Potential Hypotheses:
A. Hurried From the Backlog of Trucks because
B. The Trucks Were Not Scheduled Properly (BOTH TRUE)
4. (Path 2) Hypothesis Questioning: WHY were the trucks not inspected?
The Identified Potential Hypotheses:
A. Reduced Work Hours for Inspectors due to
B. Decision to Reduce Costs (BOTH TRUE)
5. Hypothesis Questioning: WHY were the trucks not cleaned?
The Identified Potential Hypotheses:
A. Procedure Not Adequate (NOT TRUE)
B. Procedure Adequate But Not Followed (TRUE)
6. (Path 2) Hypothesis Questioning: WHY was the adequate procedure not followed?
The Identified Potential Hypotheses:
A. No Check Step by Truck Cleaning Firm to Verify (TRUE)
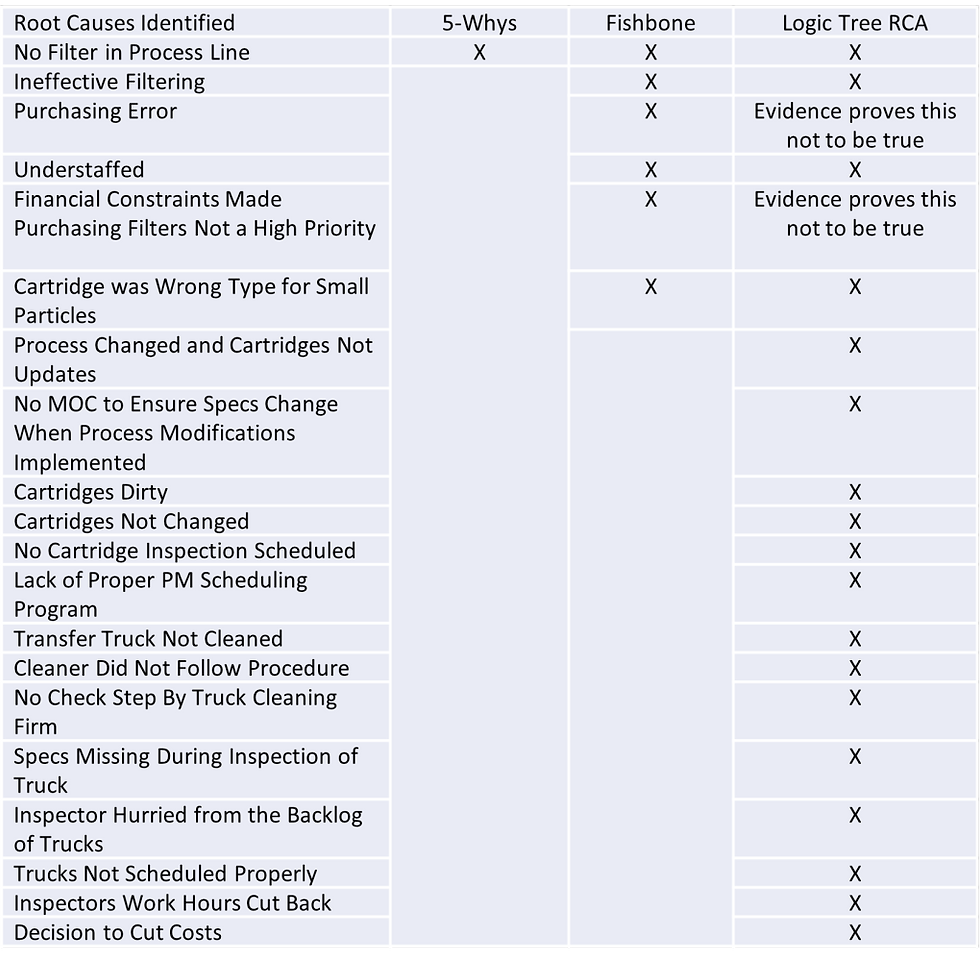
Based on the above examples of the various tools applied to the same situation, we could construct a “filter” of what tools identified which ‘root causes’ by the respective teams. This demonstrates root causes and contributing factors that could be missed by not using the most appropriate tool for the magnitude of the event being analyzed.
Conclusions:
The use of the 5-Whys leads users to believe only one (1) root cause exists. Since evidence is not normally required to validate this string of logic, that one (1) cause could likely be correct, but not the only root cause involved.
The fishbone, while more exploratory than the 5-Whys, is a brainstorming technique that relies solely on the input of the team to serve as fact. Because it is not strictly cause-and-effect based, but category based, a path to failure is murky at best. Because hearsay is the primary source of evidence, the limited causes identified could also very well be wrong (similar to trial-and-error) and/or not comprehensive enough.
The Logic Tree is more comprehensive because it attempts to “rewind the video” of the event happening. It is starting with facts and reeling backwards from that point. Evidence collected will determine what did and did not occur, not hearsay. The logic tree will drill past the physical and human levels to uncover the systems issues or the latent root causes that influenced decision-making. Without correcting the systemic issues, we will likely run the risk of recurrence of the event somewhere, sometime. By correcting the systems issues, we will correct the undesirable behaviors (decision-making processes) that triggered the physical consequences to occur and eventually harm the patient.
When evaluating which RCA processes are best for your organization be sure not to let factors such as cost, minimum compliance, time and ease of analysis, trump the important characteristics of value, comprehensiveness, operational Reliability, safety and efficiency. Otherwise as the old adage goes, we will face the “pay me now or pay me later” scenario and this is dangerous when lives are at stake.
Note: For a full print out of this logic tree on a single page, please email me (blatino@prelical.com) and just put SEND ME THE BLACK SPEC TREE in the Subject Line.
About the author:
Robert J. Latino is former CEO of Reliability Center, Inc. (RCI). Mr. Latino received his Bachelor’s degree in Business Administration and Management from Virginia Commonwealth University.
Robert J. Latino has been facilitating RCA analyses with his clientele around the world for over 38 years and has taught over 10,000 students in the PROACT® Methodology. Mr. Latino is co-author of numerous seminars and workshops on RCA as well as co-designer of the award winning PROACT® Suite Software Package.
Mr. Latino has authored or co-authored ten (10) texts on RCA related topics, the most recent being, Root Cause Analysis Improving Performance for Bottom Line Results (5th Ed). Many of the principles and graphics used in this article are cited in the book described above.
Contact Info: blatino@prelical.com or www.prelical.com
LI Profile: https://www.linkedin.com/in/boblatino/
References:
[1] Brue, Greg. The Elephant in the Operating Room. Quality Digest. June 2005. Pgs. 49 – 55.
[2] Latino, Robert. Root Cause Analysis: Improving Performance for Bottom Line Results [5th Ed]. July 2019..
[4] Croteau, Richard et al. Error Reduction in Health Care: A Systems Approach to Improving Patient Safety (San Francisco: Jossey Bass Publishers, 2000), p. 181.
[5] C. Perrow. Normal Accidents: Living With High-Risk Technologies (New York: Basic Books, 1984), pp. 89-100.
[6] MS Word is a registered trademark ® of the Microsoft Corporation
[7] Croteau, Richard et al. Error Reduction in Health Care: A Systems Approach to Improving Patient Safety (San Francisco: Jossey Bass Publishers, 2000), p. 192
[8] Wachter, R. M.; Shojania, K. G. et al. Internal Bleeding (New York: Rugged Land Publishers LLC, 2004), p. 116.


Comments